

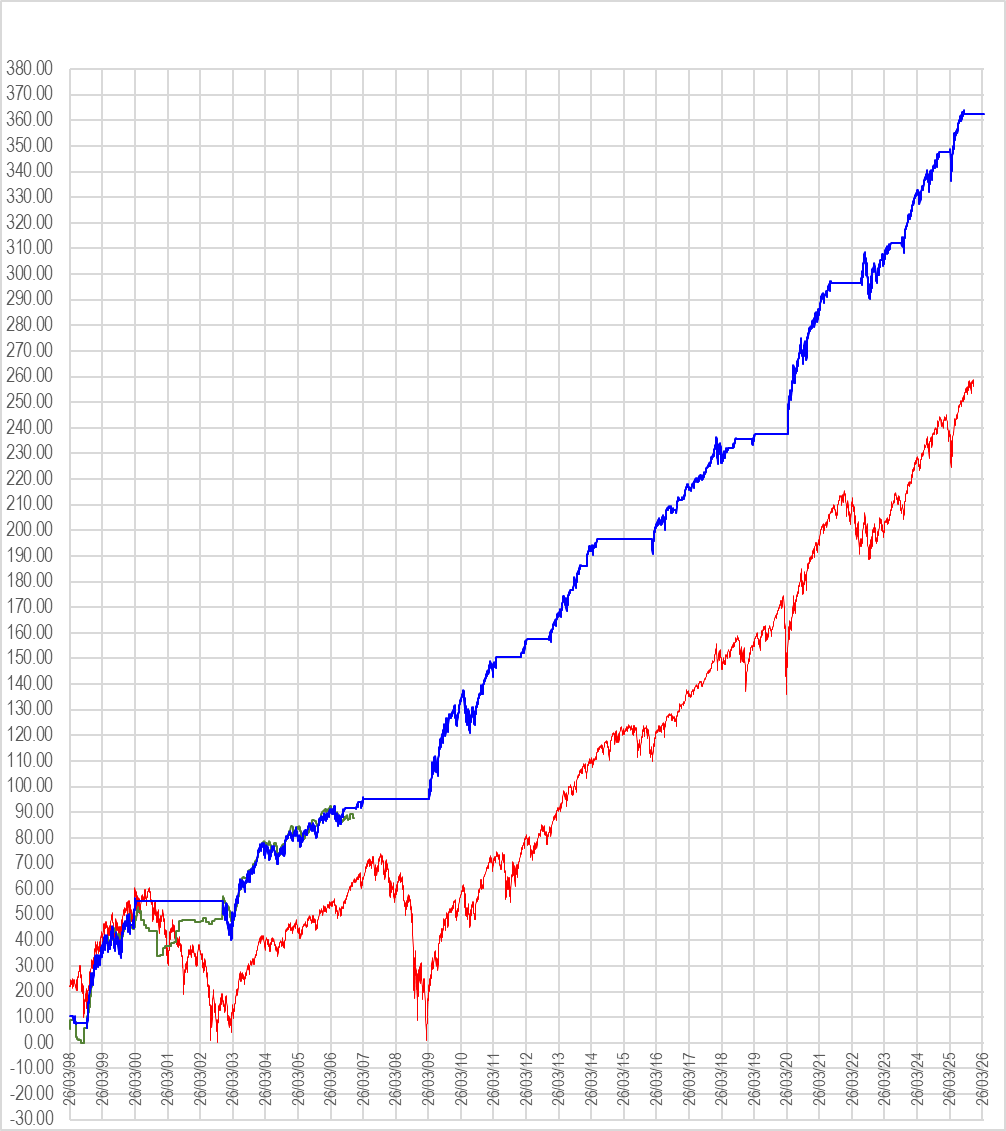
Most traders rely on lagging technical indicators like the Moving Average Crossover to time their exits. The problem is simple: by the time these indicators signal a crash, the big fall has already happened — and by the time they signal a re-entry, the rebound is well underway. The UIS Risk Rating is different. It is predictive, based on company Earnings Estimates that look months ahead, so you can exit before a Bear crash and re-enter early to catch the recovery. The chart below shows the difference this makes over nearly three decades.
A Typical Trend Following Technical Analysis Technique
Many techniques are used in technical analysis to trade stocks and commodities.
The most common is the Moving Average Crossover method. It generally takes only Long (Up) trades, as the S&P500 long-term trend is Up.
- Calculate a short Moving Average (MA) of around 20 bars and a longer MA of around 200 bars.
- Enter a trade when the short MA crosses above the longer MA by a threshold %.
- Exit the trade when the short MA crosses below the longer MA by a threshold %.
The type of averaging can range from a Simple MA to a Weighted MA or an Exponential MA. Short MA lengths typically vary from 10 to 30 bars, and longer MA lengths are usually 100 to 250 bars. The example chart below is based on a short MA of 20 and a long MA of 200.
Moving Average Crossover Equity Chart
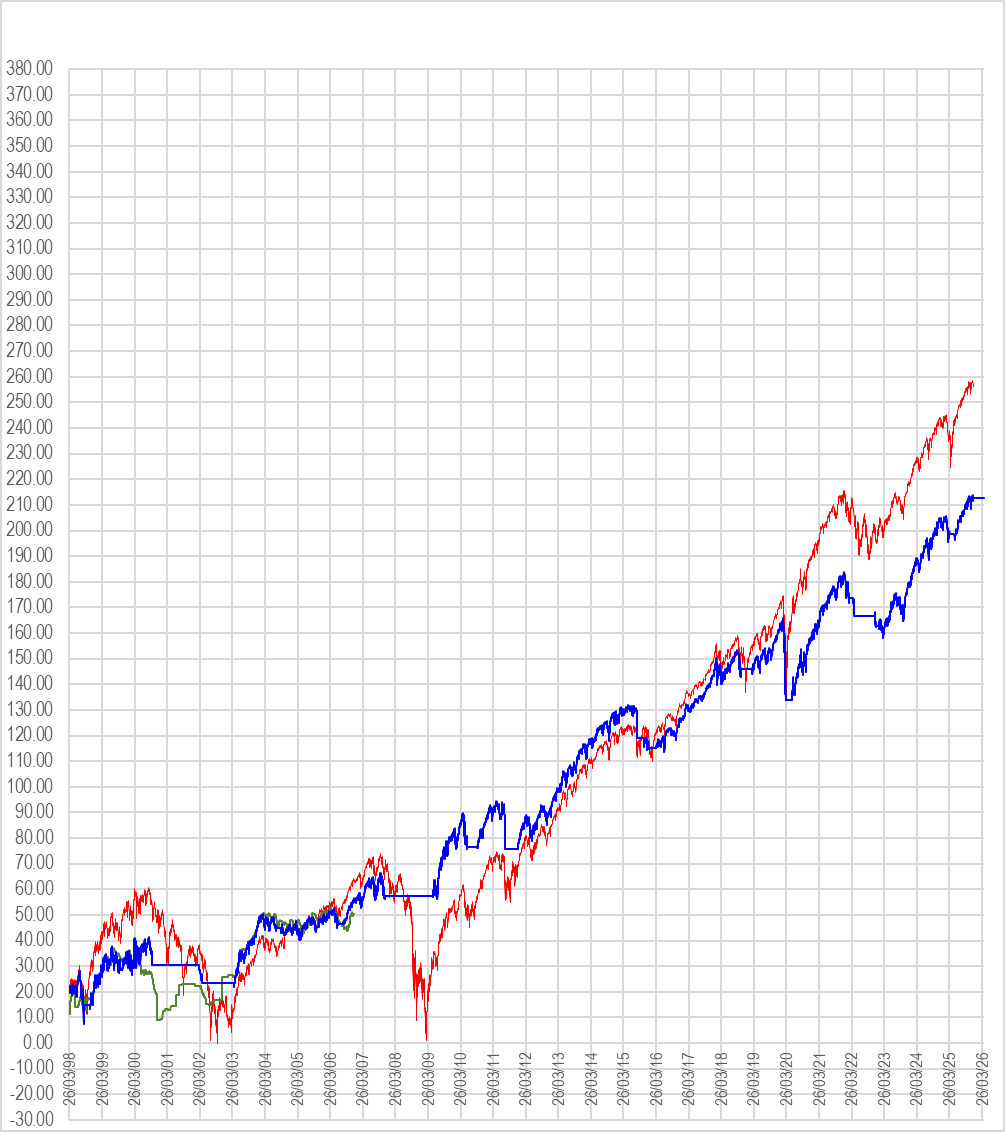
The equity line shows:
- 1The MA Crossover system reduces the impact of most of the big Bear crashes. Drawdowns are reduced significantly during the big Bear crashes.
- 2Drawdowns in other periods are not reduced.
- 3The equity line is reasonably smooth and shows a reliable long-term Up trend. Equity at the end of 2025 is approx. 212%, which equates to an average annual ROI of 7.8%.
- 4Overall, the MA Crossover system is adequate for avoiding big Bear crashes, but it doesn't beat long-term Buy and Hold, which delivers a long-term average annual ROI of 9.5%.
| Big Bear date | SPY Buy and Hold drawdown | MA Crossover drawdown |
|---|---|---|
| 2001 | -58% | -19% |
| 2008 | -70% | -10% |
Why Does the MA Crossover Method Underperform?
The inherent problem with nearly all technical analysis techniques is lag. When a trading signal is generated, it is usually late.
When the S&P500 falls, it does so suddenly and rapidly. By the time an MA Crossover exit signal is generated, it is already too late, as the initial fall has already occurred.
Similarly, at the end of a Bear period, the MA Crossover will generate a re-entry signal, but only some time after the rebound recovery has begun.
Overall, technical analysis methods such as the Moving Average Crossover suffer losses when the S&P500 suddenly falls, and miss a lot of profit when the S&P500 rebounds.
This can be seen in the following charts for two periods of significant S&P500 falls, in 2015 and 2022.
2015 Fall: UIS Risk Rating vs MA Crossover
UIS Risk Rating Equity: 2015
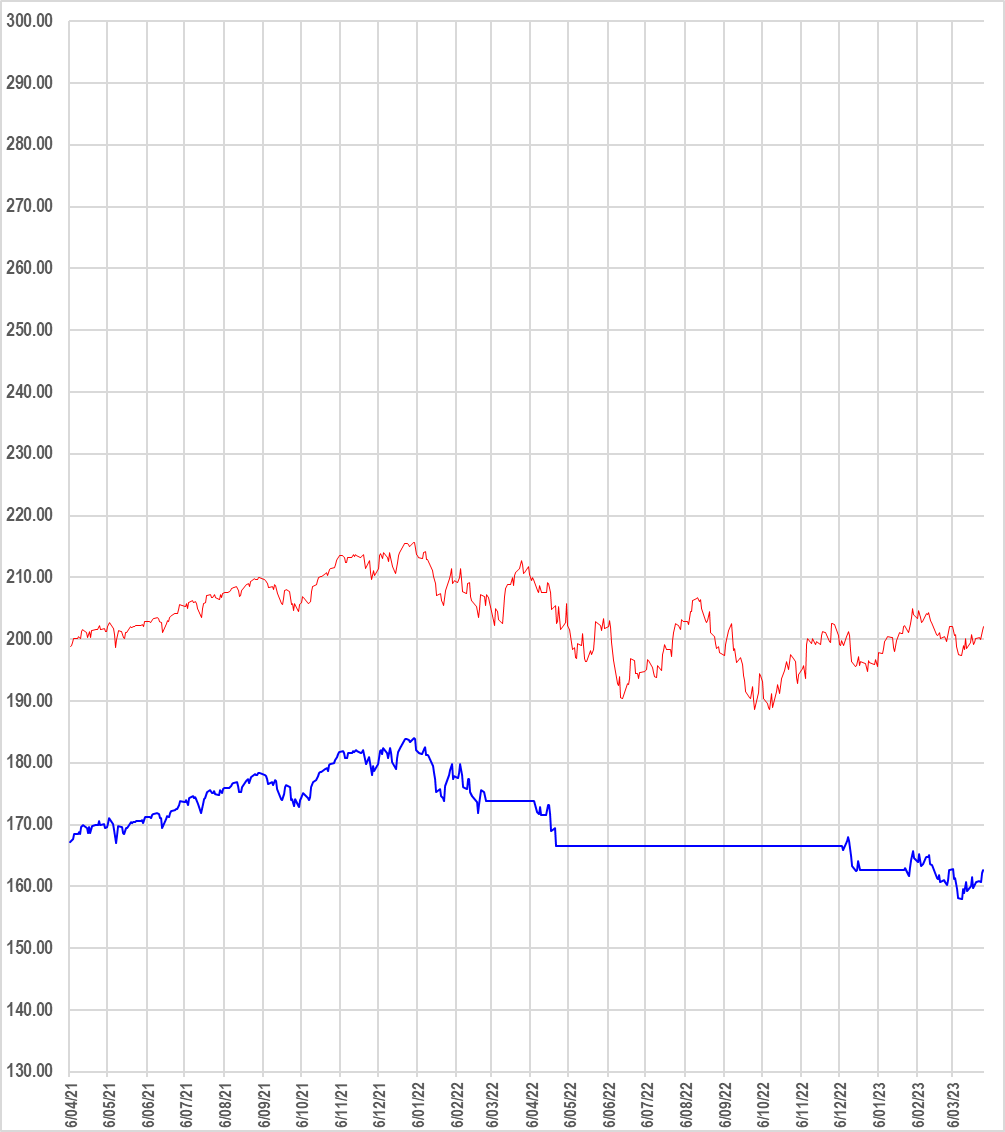
The UIS Risk Rating system exited early to avoid losses and re-entered early to catch the rebound.
MA Crossover: 2015
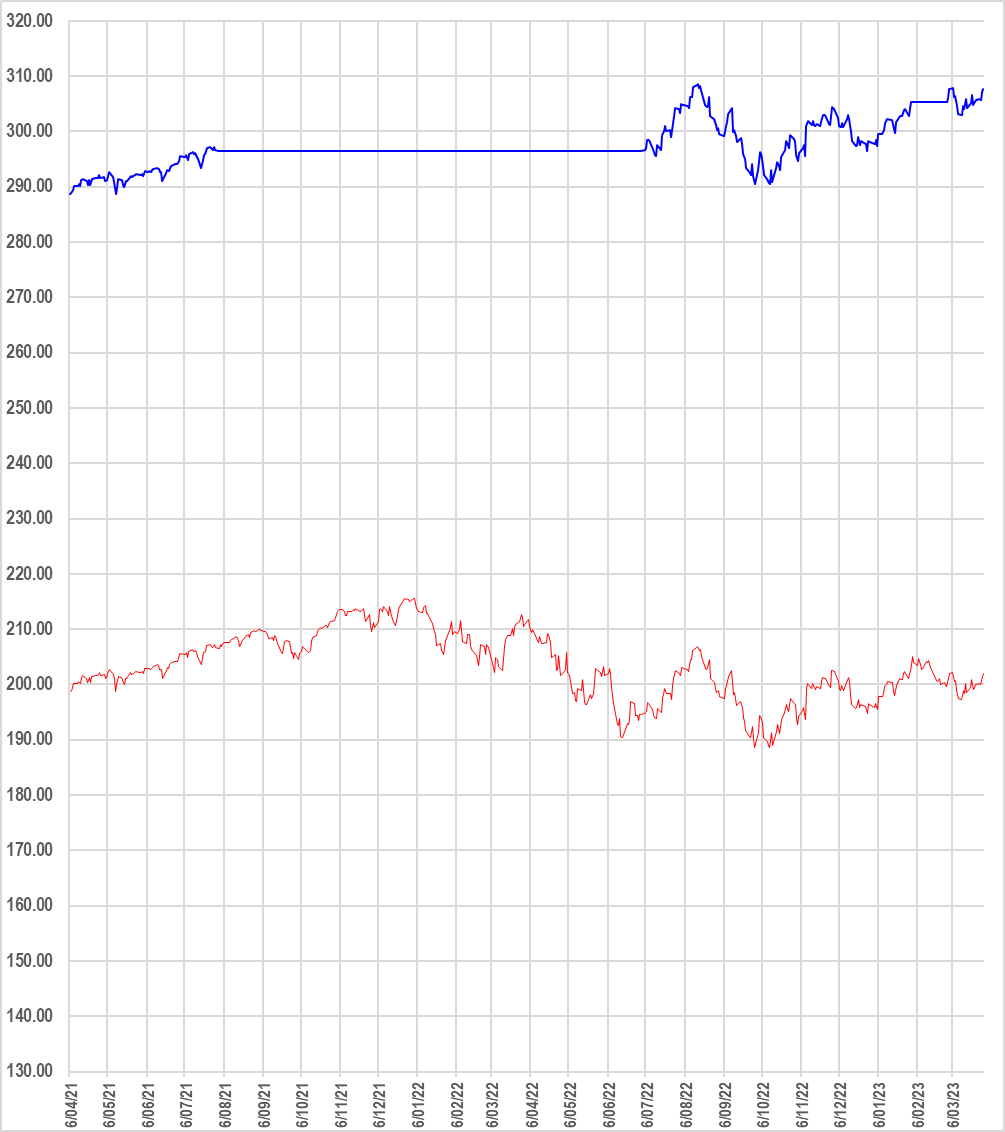
The MA Crossover system suffered a big loss at the start of the crash, as the exit signal was too late. The rebound recovery was almost totally missed.
2022 Fall: UIS Risk Rating vs MA Crossover
UIS Risk Rating Equity: 2022
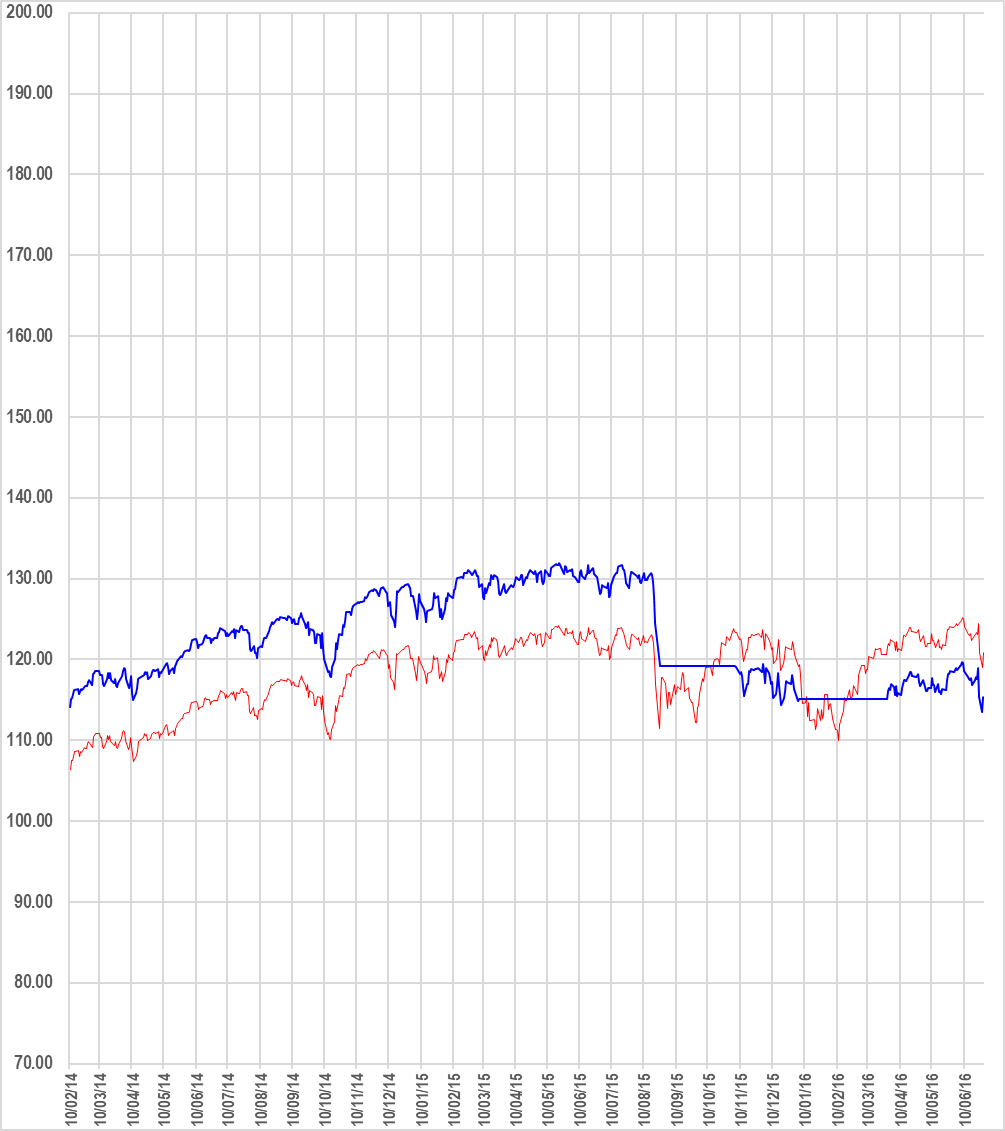
The UIS Risk Rating system exited early to avoid losses and re-entered early to catch the rebound.
MA Crossover: 2022
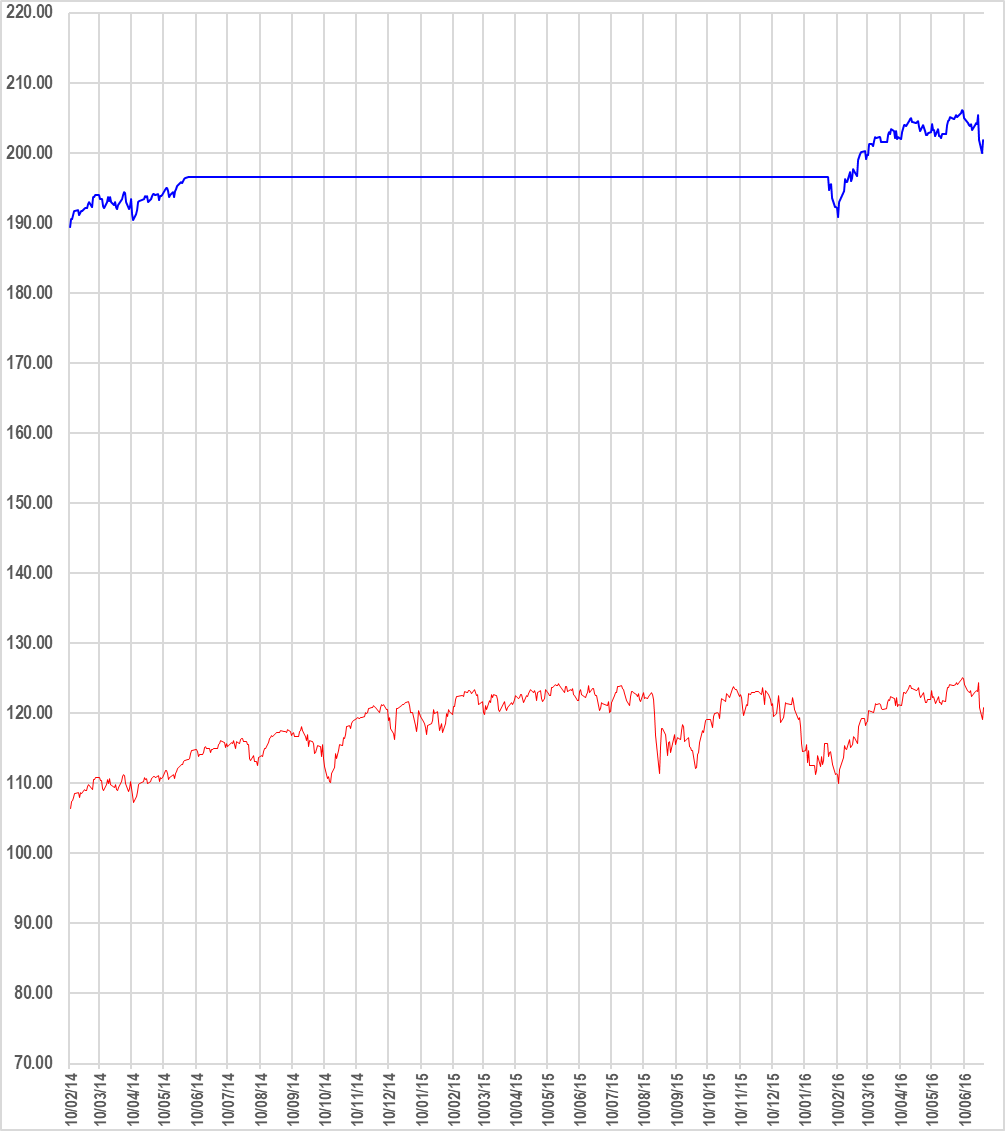
The MA Crossover system suffered a big loss at the start of the crash, as the exit signal was too late. The rebound recovery was almost totally missed.
Summary
Lag is the main problem with most technical indicators. When a big fall occurs, the first day is usually a crash, so exiting late with most technical indicators means you have already suffered a big loss.
Trend following methods invariably lag, which results in big losses when a fall starts and missed profits when the market rebounds.
Trading with the UIS Risk Ratings enters and exits in advance of trend changes, because the UIS Risk Ratings are predictive.

Discover the Trading Conditions for the Next 3 Months
The most important feature of the UIS Risk Ratings is that predictions are released at least one month ahead of a crash.
Why Subscribe