

What Drives a Share Price?
Company Earnings are the driver for the Fundamental Intrinsic Value of a company's share price.
PE reversion to the mean is a feature of most stock markets. Stock prices tend to move in cycles, with the PE ratio rising to over 20, then crashing before reverting to a mean of around 17.
1Fundamental Intrinsic Value (FIV)
Based on Return on Investment (ROI) and Earnings. The FIV doesn't vary much unless Earnings crash or escalate.
2Speculative Value (SV)
Based on anticipated future value, Earnings growth or just share price mania. Can go to extreme levels with "irrational exuberance" and crash back to zero at any time.
The New York Stock Exchange
The London Stock Exchange started in 1773 and was based on the Amsterdam Stock Exchange model for company structure and regulation.
The New York Stock Exchange (NYSE) was founded in 1792 and was based on the London Stock Exchange model.
Companies were initially listed on the exchange with limited transparency, regulation and reporting of performance. Investors were primarily looking for a Return On Investment, but speculation was rife. Insider trading and other market distortions saw share prices cycle through boom and bust during the 1800s.
After the 1929 Wall Street Crash, improved regulation, combined with major "old money" investors looking for less volatility and speculation, put more emphasis on Earnings and the Price to Earnings ratio. In other words, a return to the basics of looking at ROI from business profits (Earnings).
Post-1929: Big investors and fund managers assigned an expected PE range to each stock sector. For example, utility companies were seen as low risk, with consistent, reliable profits or Earnings. An ROI of under 5% was often accepted, which equates to a PE of 20.
Since the mid-1900s, the S&P500 PE has followed a regular cycle, without reaching sky-high extremes.

NYSE and S&P500 PE Ratio Cycles
Speculative Stock Exchanges
Younger stock exchanges, such as many Asian exchanges, are still going through a highly speculative phase. The Japanese stock market escalated from the 1960s until 1989 with little regard for Earnings or the PE ratio.
A crash in 1989 led many investors to realise that Nikkei stock prices were not based on fundamental values and were unsustainable. Investors went back to basics, investing according to business profits (Earnings).
Unfortunately, many Japanese companies were not very profitable, and a number collapsed after the crash. Overall, the 225 companies in the Nikkei 225 battled to restructure and focus on profits. Companies were not profitable enough for Earnings to push Nikkei prices into a long-term uptrend until around 2000.
It was not until 2004 that the Nikkei PE ratio became widely reported and applied to investing.
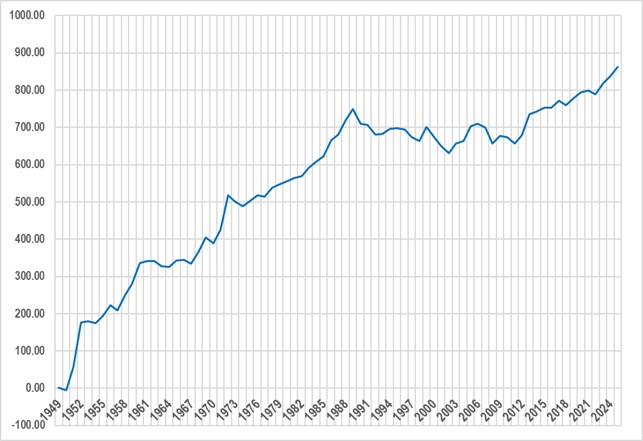
Nikkei 225 Price Chart
Other Asian markets experience varying levels of speculation and volatility. Each stock market index will only become stable and predictable once a large number of big companies demonstrate consistent Earnings growth over one or two decades.

Nikkei 225 PE Ratio Chart
Since 2004, the Nikkei PE ratio has shown that Japanese stocks are now following fundamental principles.
How to Cut Your Losses Dramatically
Beat Buy and Hold with UIS Risk Ratings. Simply applying the UIS Risk Ratings as an exit indicator for Buy and Hold trading of the S&P500 has a dramatic effect on trading results. The Return On Investment was much higher than Buy and Hold, with significantly less risk.
Beat Buy and Hold with the UIS Risk Ratings
Protect Your Portfolio with UIS Risk Ratings
Our proprietary indicators have accurately flagged every S&P500 bear market crash since 1997.

Sample UIS Risk Rating Report